MarketsSep 2025–Oct 2025Project
Equity strategy backtester
Excel / VBA
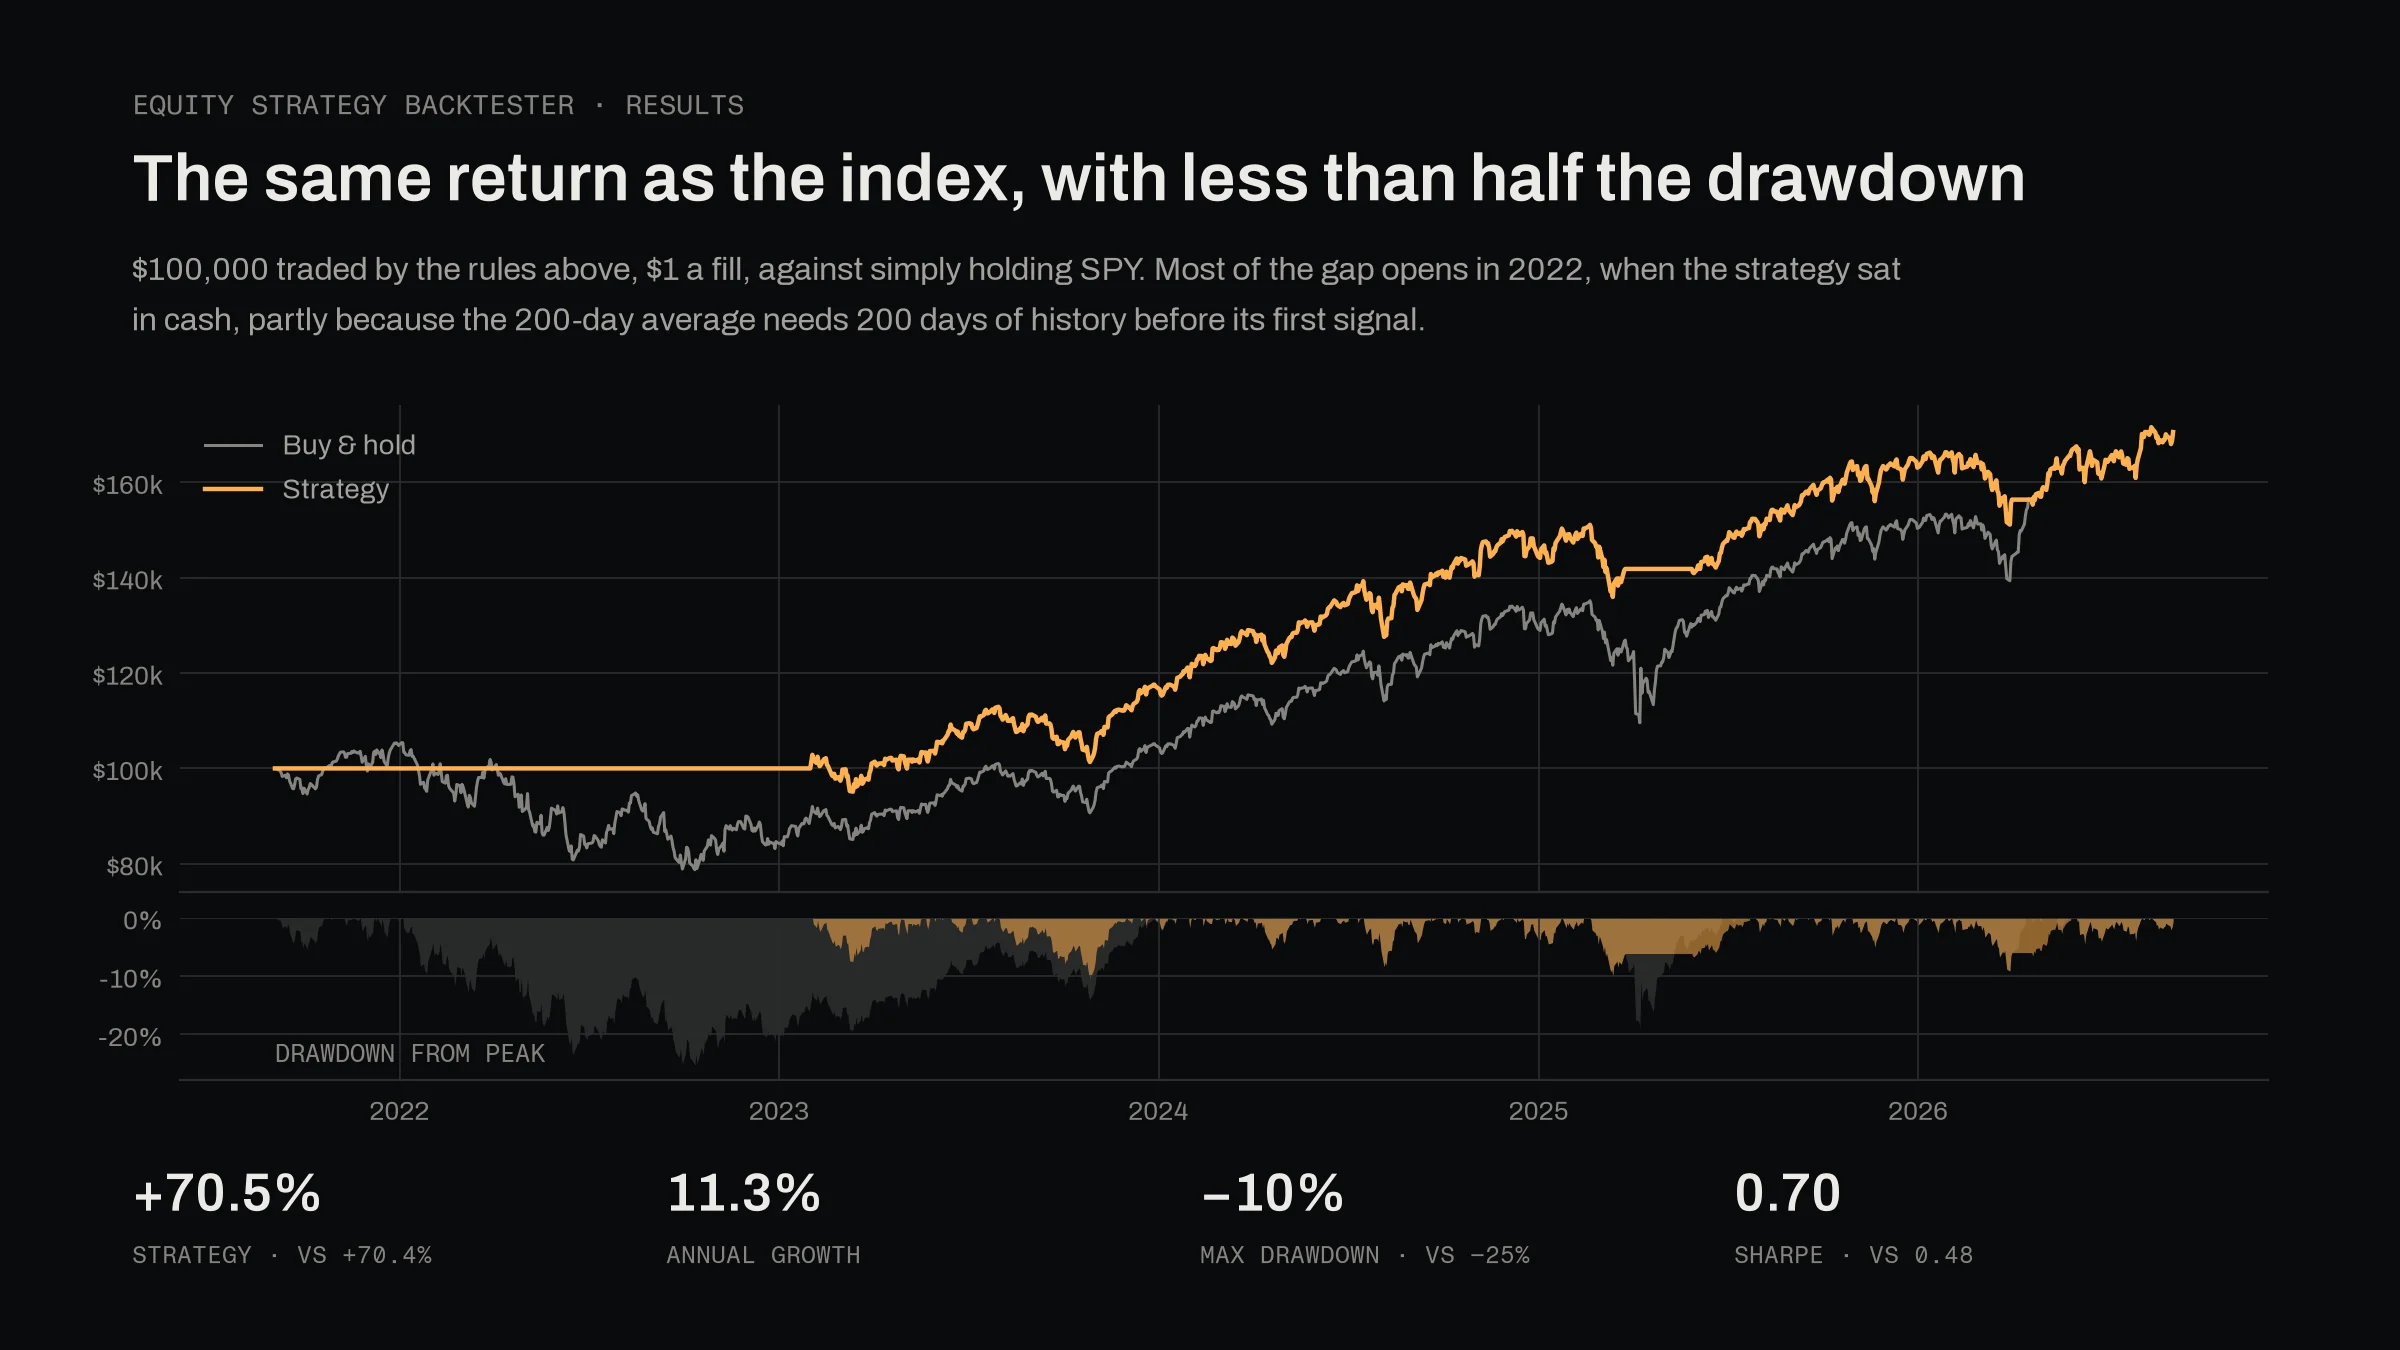
- Return over 5 years
- +70.5%
- Sharpe · vs 0.48
- 0.70
- Max drawdown · vs −25%
- −10%
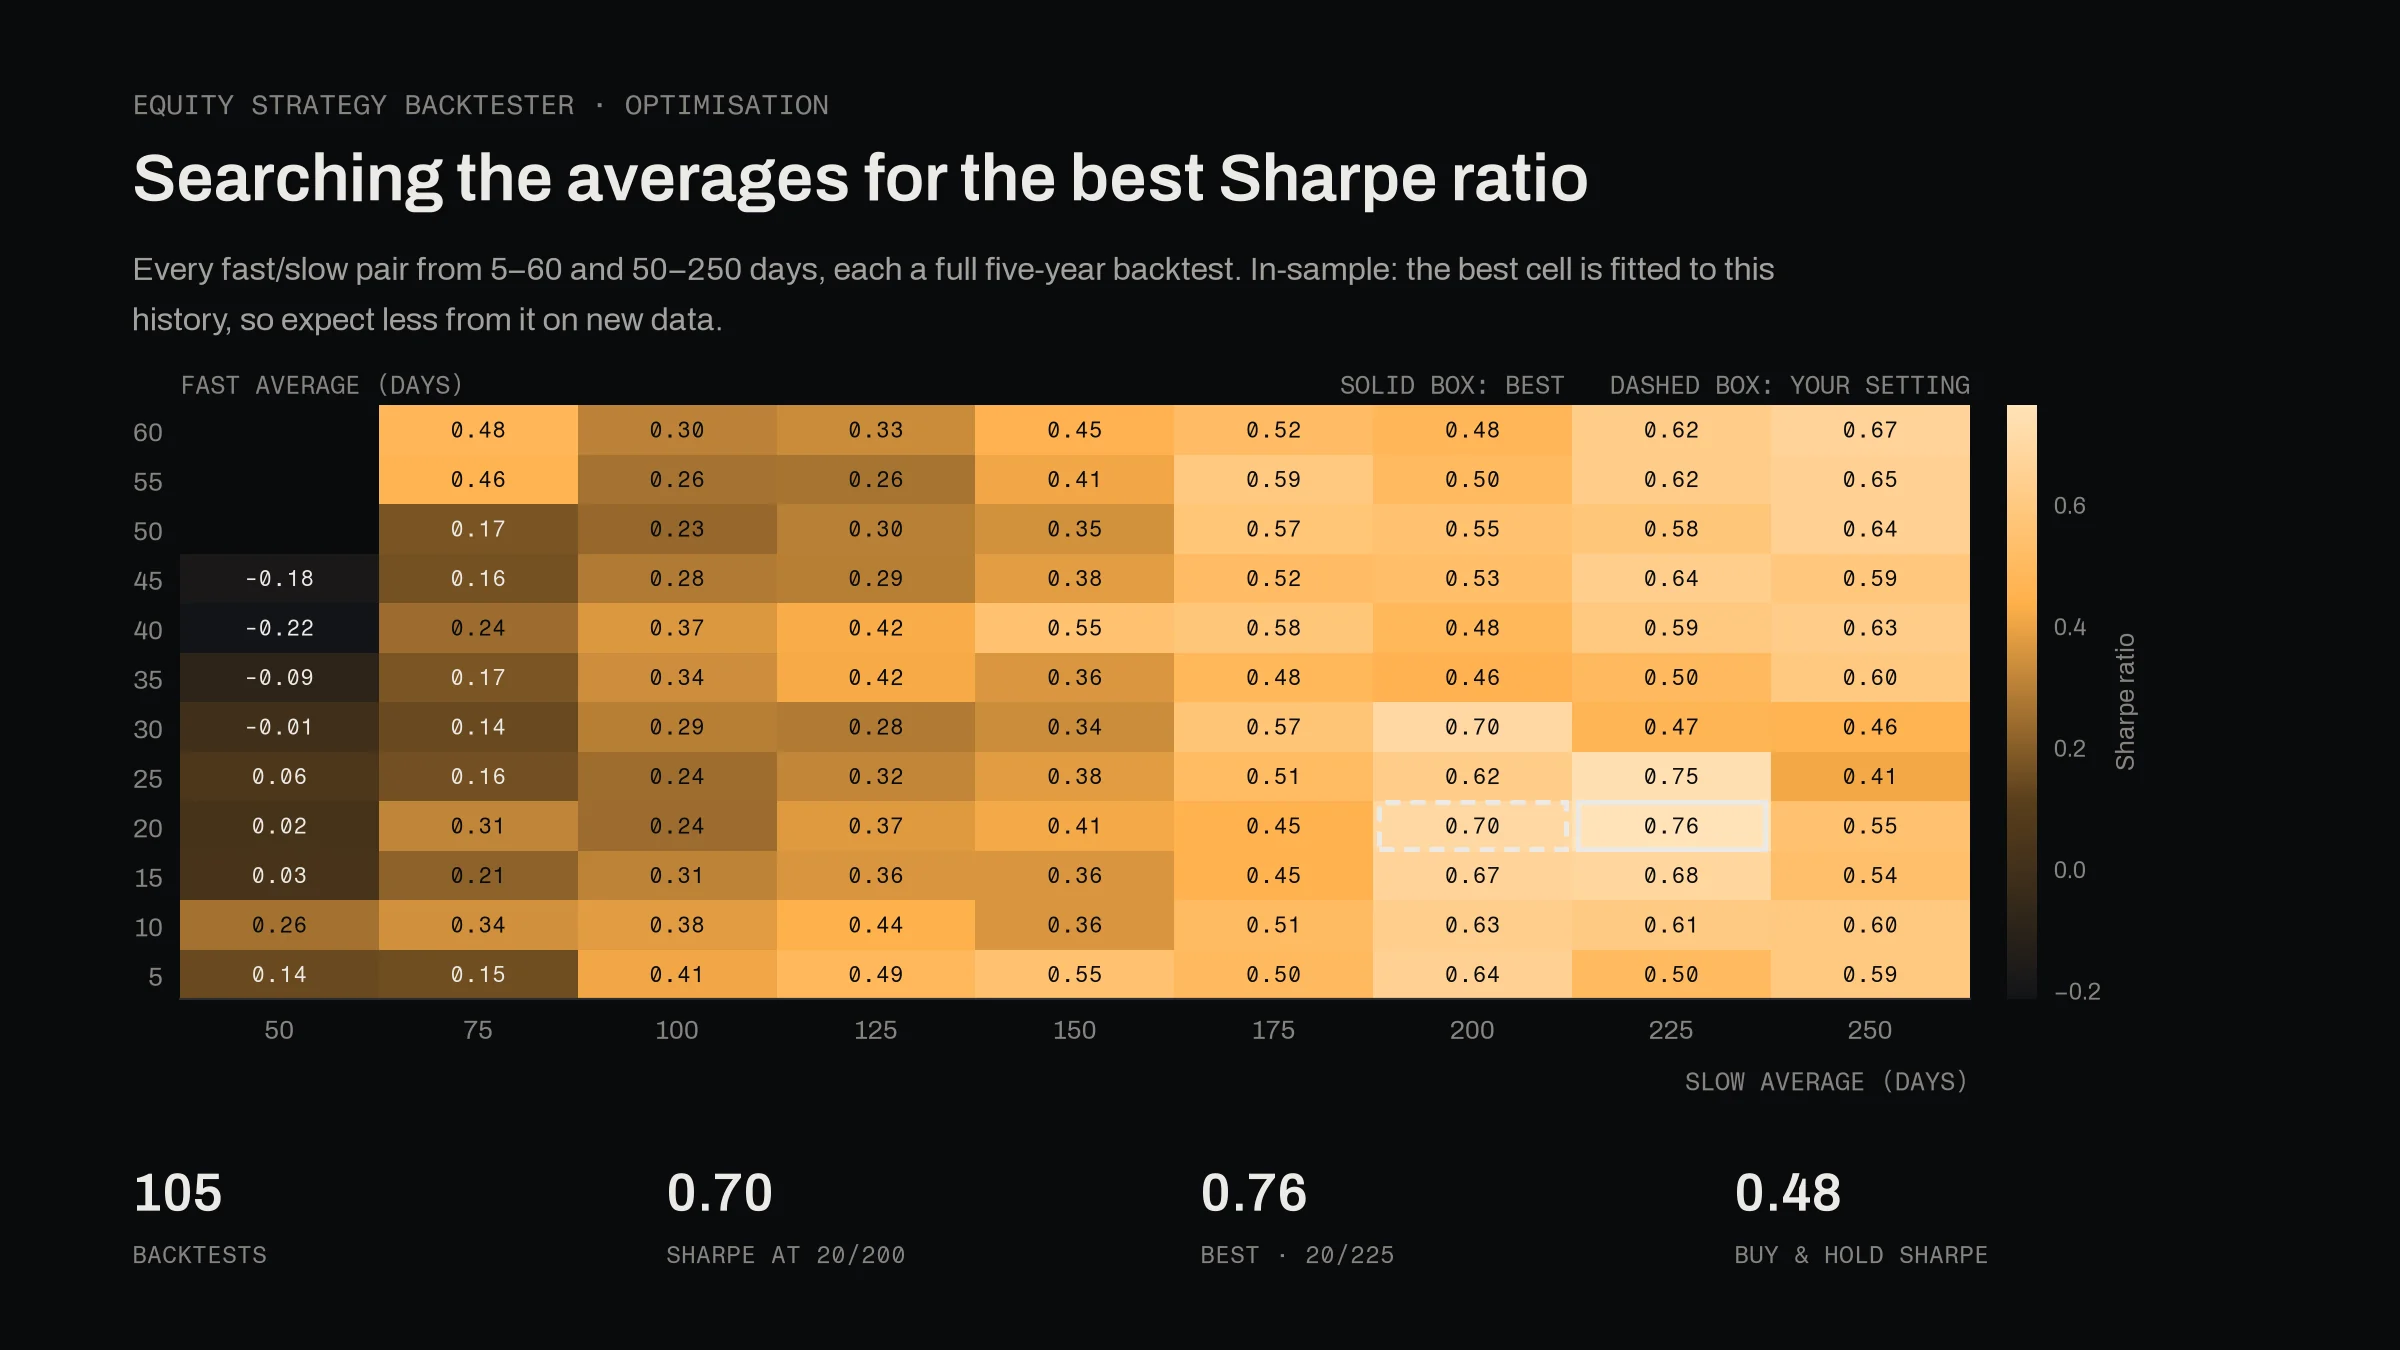
- Settings tested
- 105
Context
I wanted to test simple trading rules on real data before trusting them, so I built a backtester.
What I did
- 01Automated signal generation and P/L tracking for SMA and RSI strategies over five years of S&P data.
- 02Optimised the parameters to improve the Sharpe ratio.
- 03Tested risk-management tools on top of each strategy.
Outcome
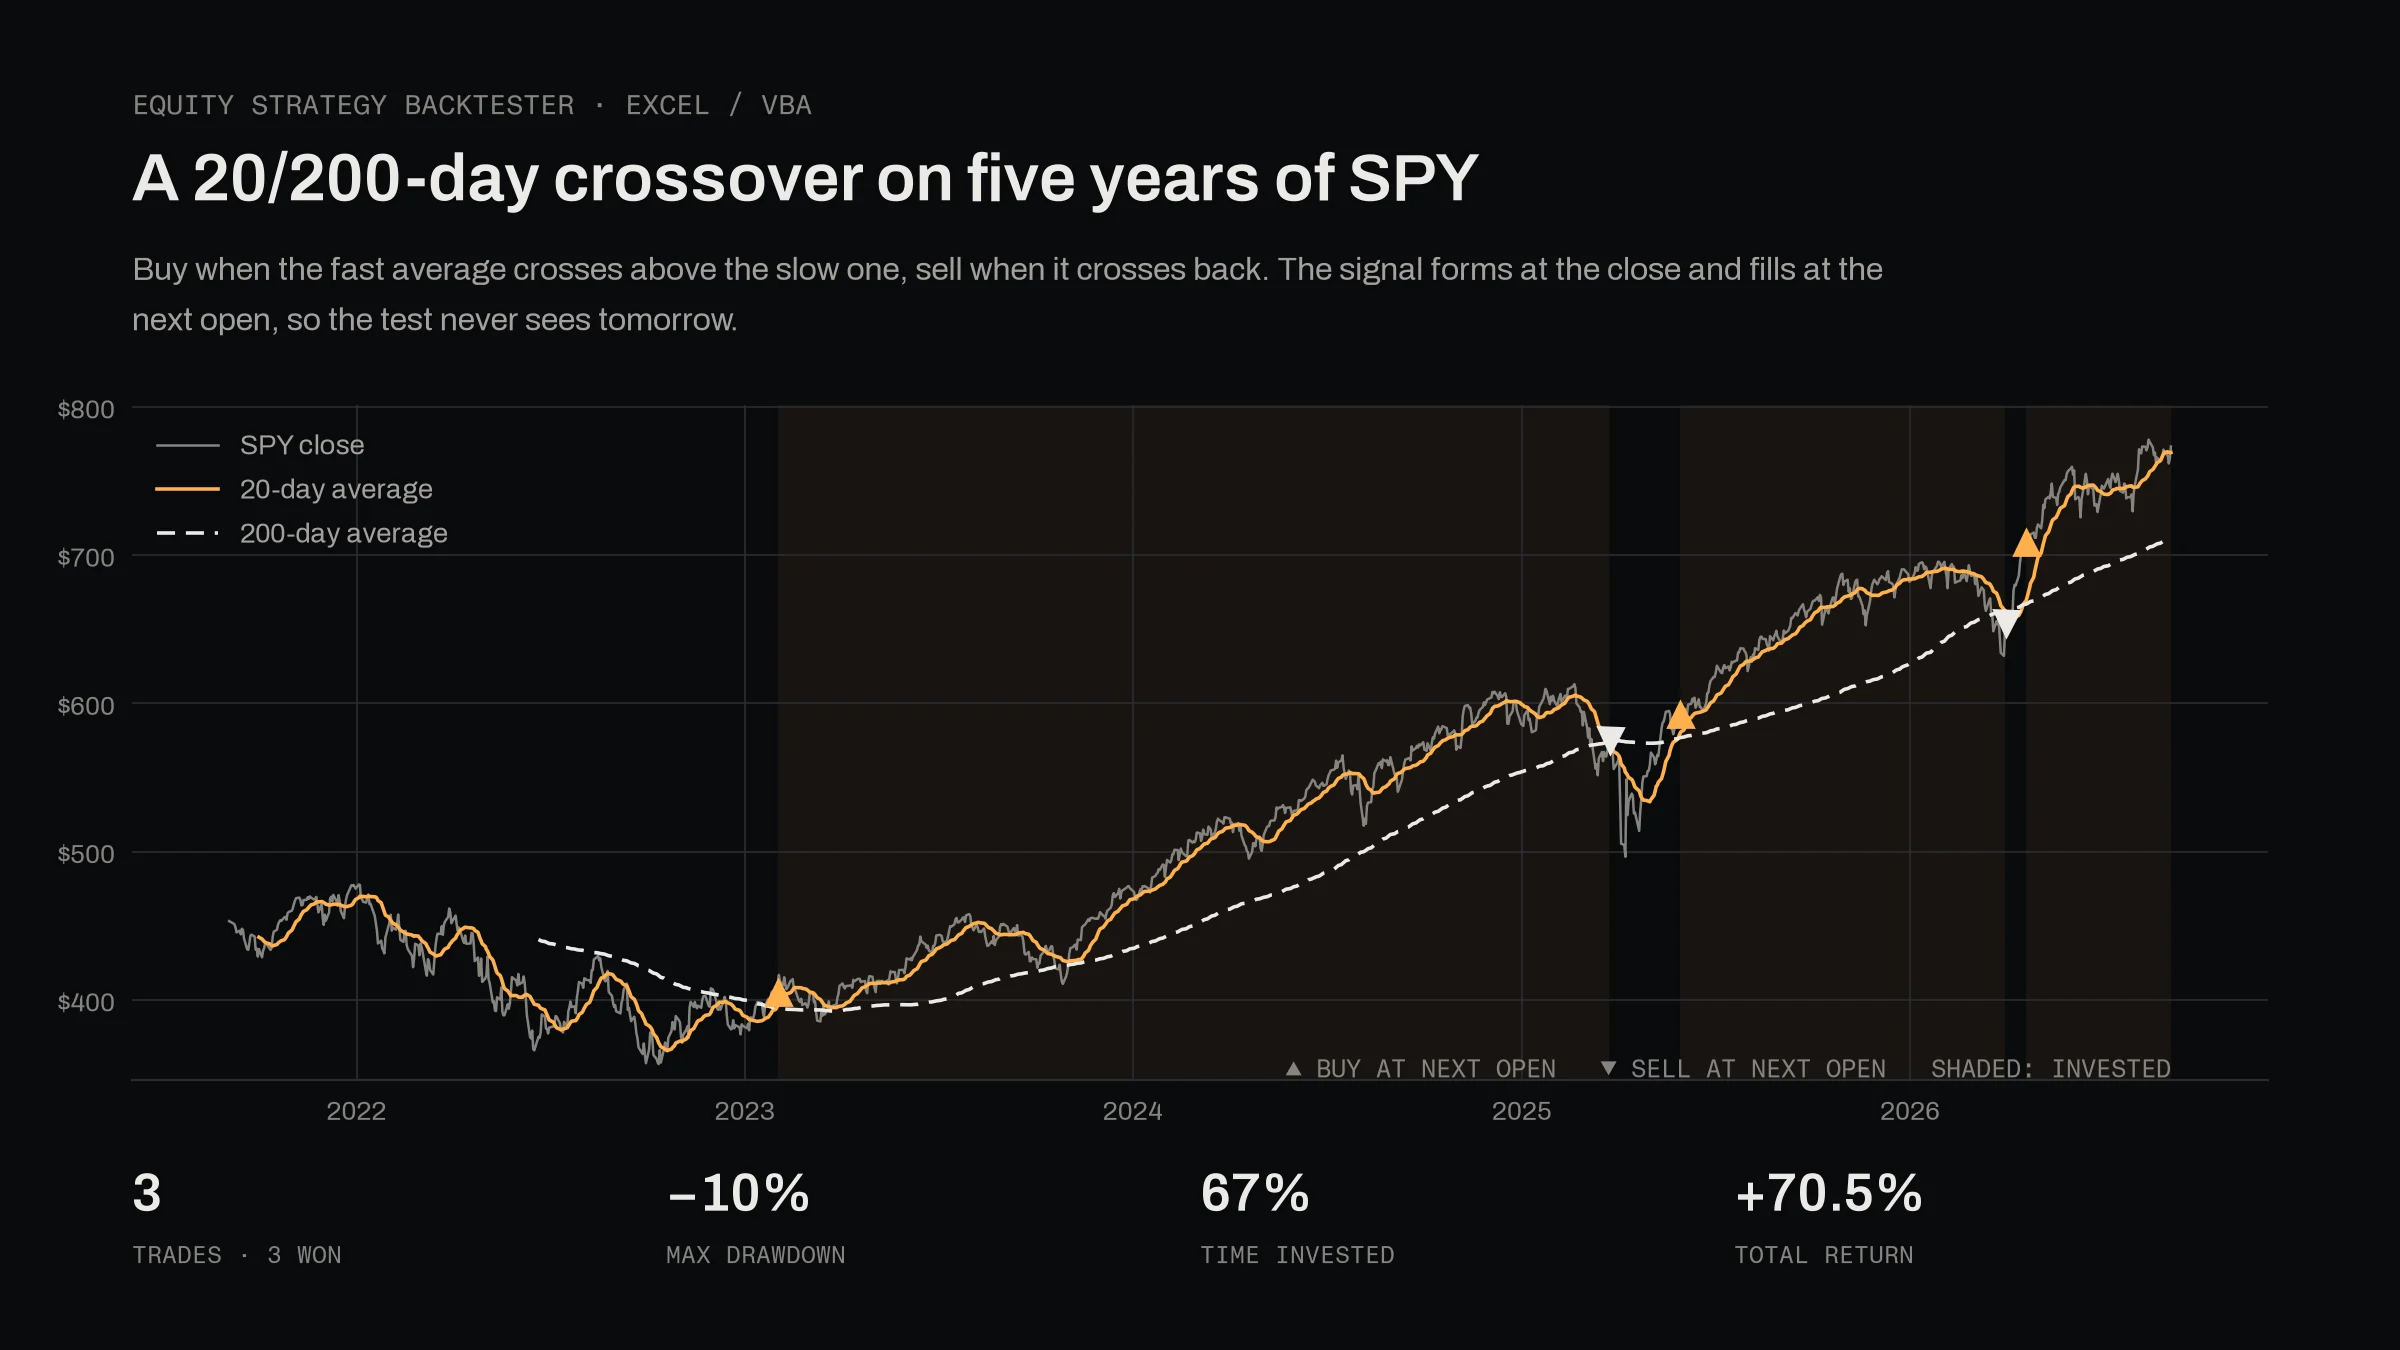
In-sample, a 20/200-day crossover matched buy-and-hold over five years (+70.5% against +70.4%) with less than half the drawdown, lifting the Sharpe ratio from 0.48 to 0.70.
Limitations
- Three trades. At 20/200 the strategy traded three times in five years, far too few to show the rule works; the 100% win rate means nothing.
- No out-of-sample test. The settings were searched on the same five years they're judged on, so the best one (20/225) is fitted to this history.
- One instrument, one regime: SPY only, over a window that was mostly a bull market with one drawdown (2022).
- Prices exclude dividends and cash earns nothing while out of the market, which understates both sides, buy-and-hold most.
- Costs are $1 a trade with fills at the next open: no spread, slippage or tax.
Charts
 Full size (opens in a new tab)
 Full size (opens in a new tab)
 Full size (opens in a new tab)
Tools
- Excel
- VBA